Part VI: Dev Tooling — The TUI That Ties It All Together
Parts I–V described what the system does: AST inference, bidirectional queries, architecture metrics, hexagonal ports, AI-driven self-implementation. This part shows how the developer drives it — through two complementary terminal interfaces.
The Command Dashboard
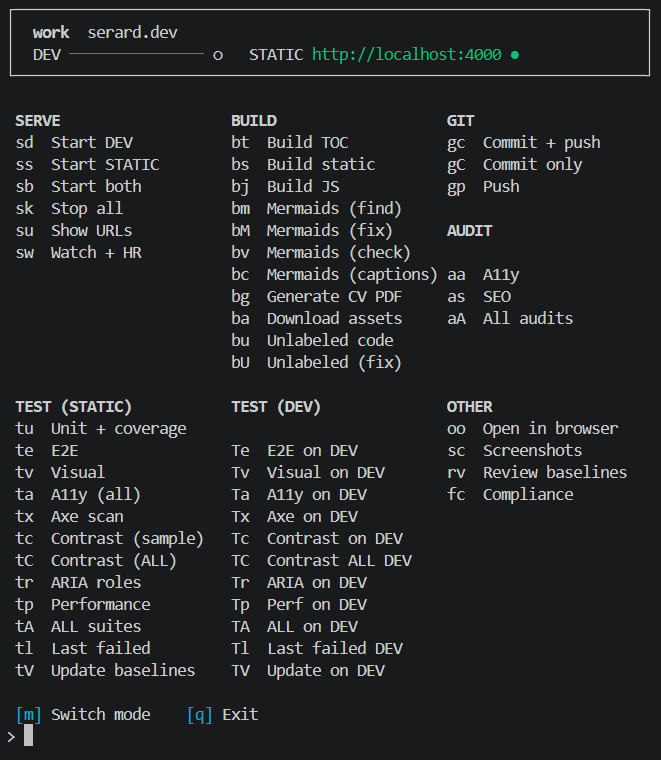
The dashboard is the entry point. It lays out every operation the project supports — serve, build, test, audit, git — in a single screen with two-letter mnemonics. bs builds the static site, tu runs unit tests with coverage, aa runs the full accessibility sweep. No documentation to consult, no flags to remember.
The top bar shows the current workspace, the dev server status, and whether the static server at localhost:4000 is alive. The layout is grouped by concern: Serve on the left (start/stop dev and static servers, launch the file watcher), Build in the centre (TOC, static, JS, mermaids, captions, assets, unlabeled code), Test split into static-target and dev-target columns, and Git and Audit on the right.
The design principle: every pipeline step from the previous five parts — compliance scan, mermaid rendering, link validation, coverage gating — is reachable from this screen in two keystrokes.
The Watcher
The second mode is a file watcher that monitors src/, css/, content/, fonts/, test/, requirements/, index.html, and site.yml.
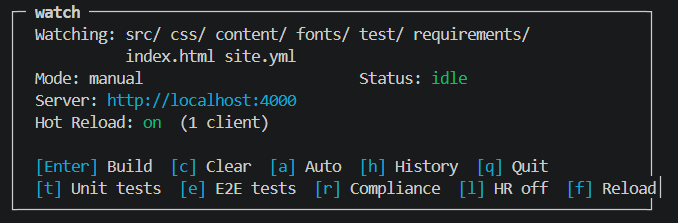
When idle, the watcher displays its watch targets, the current mode (manual or auto), the server URL, and the hot-reload status. The bottom bar offers shortcuts: [Enter] to build, [a] to toggle auto-build, [t] for unit tests, [e] for E2E, [r] for compliance.
Change Accumulation and Pipeline Computation
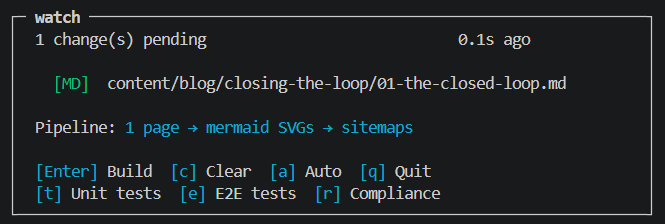
The moment a file changes, the watcher classifies it and computes the minimal pipeline. A markdown edit triggers a page rebuild, mermaid SVG regeneration, and sitemap update:
When multiple file types change at once — say a markdown file, an image, and an image directory — the pipeline extends to include the copy images step:
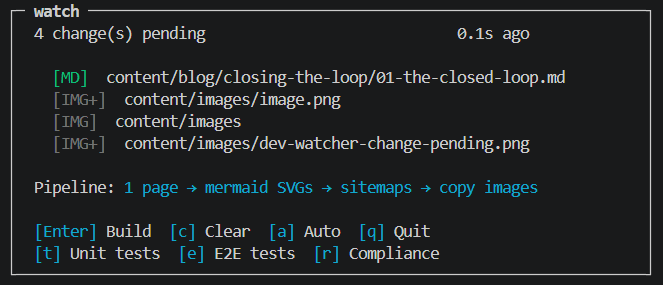
The watcher does not rebuild immediately in manual mode. It accumulates changes and shows what would happen, letting the developer batch edits before pressing [Enter]. In auto mode, it debounces and fires automatically.
This is the feedback loop that makes the infrastructure from Parts I–V usable in practice: change a test, see the compliance report update; edit a markdown file, see the page and its mermaid diagrams rebuild; add an image, see it flow through the asset pipeline. Two dashboards, zero context-switching.